From sky to Sewer: Following the rain through the city
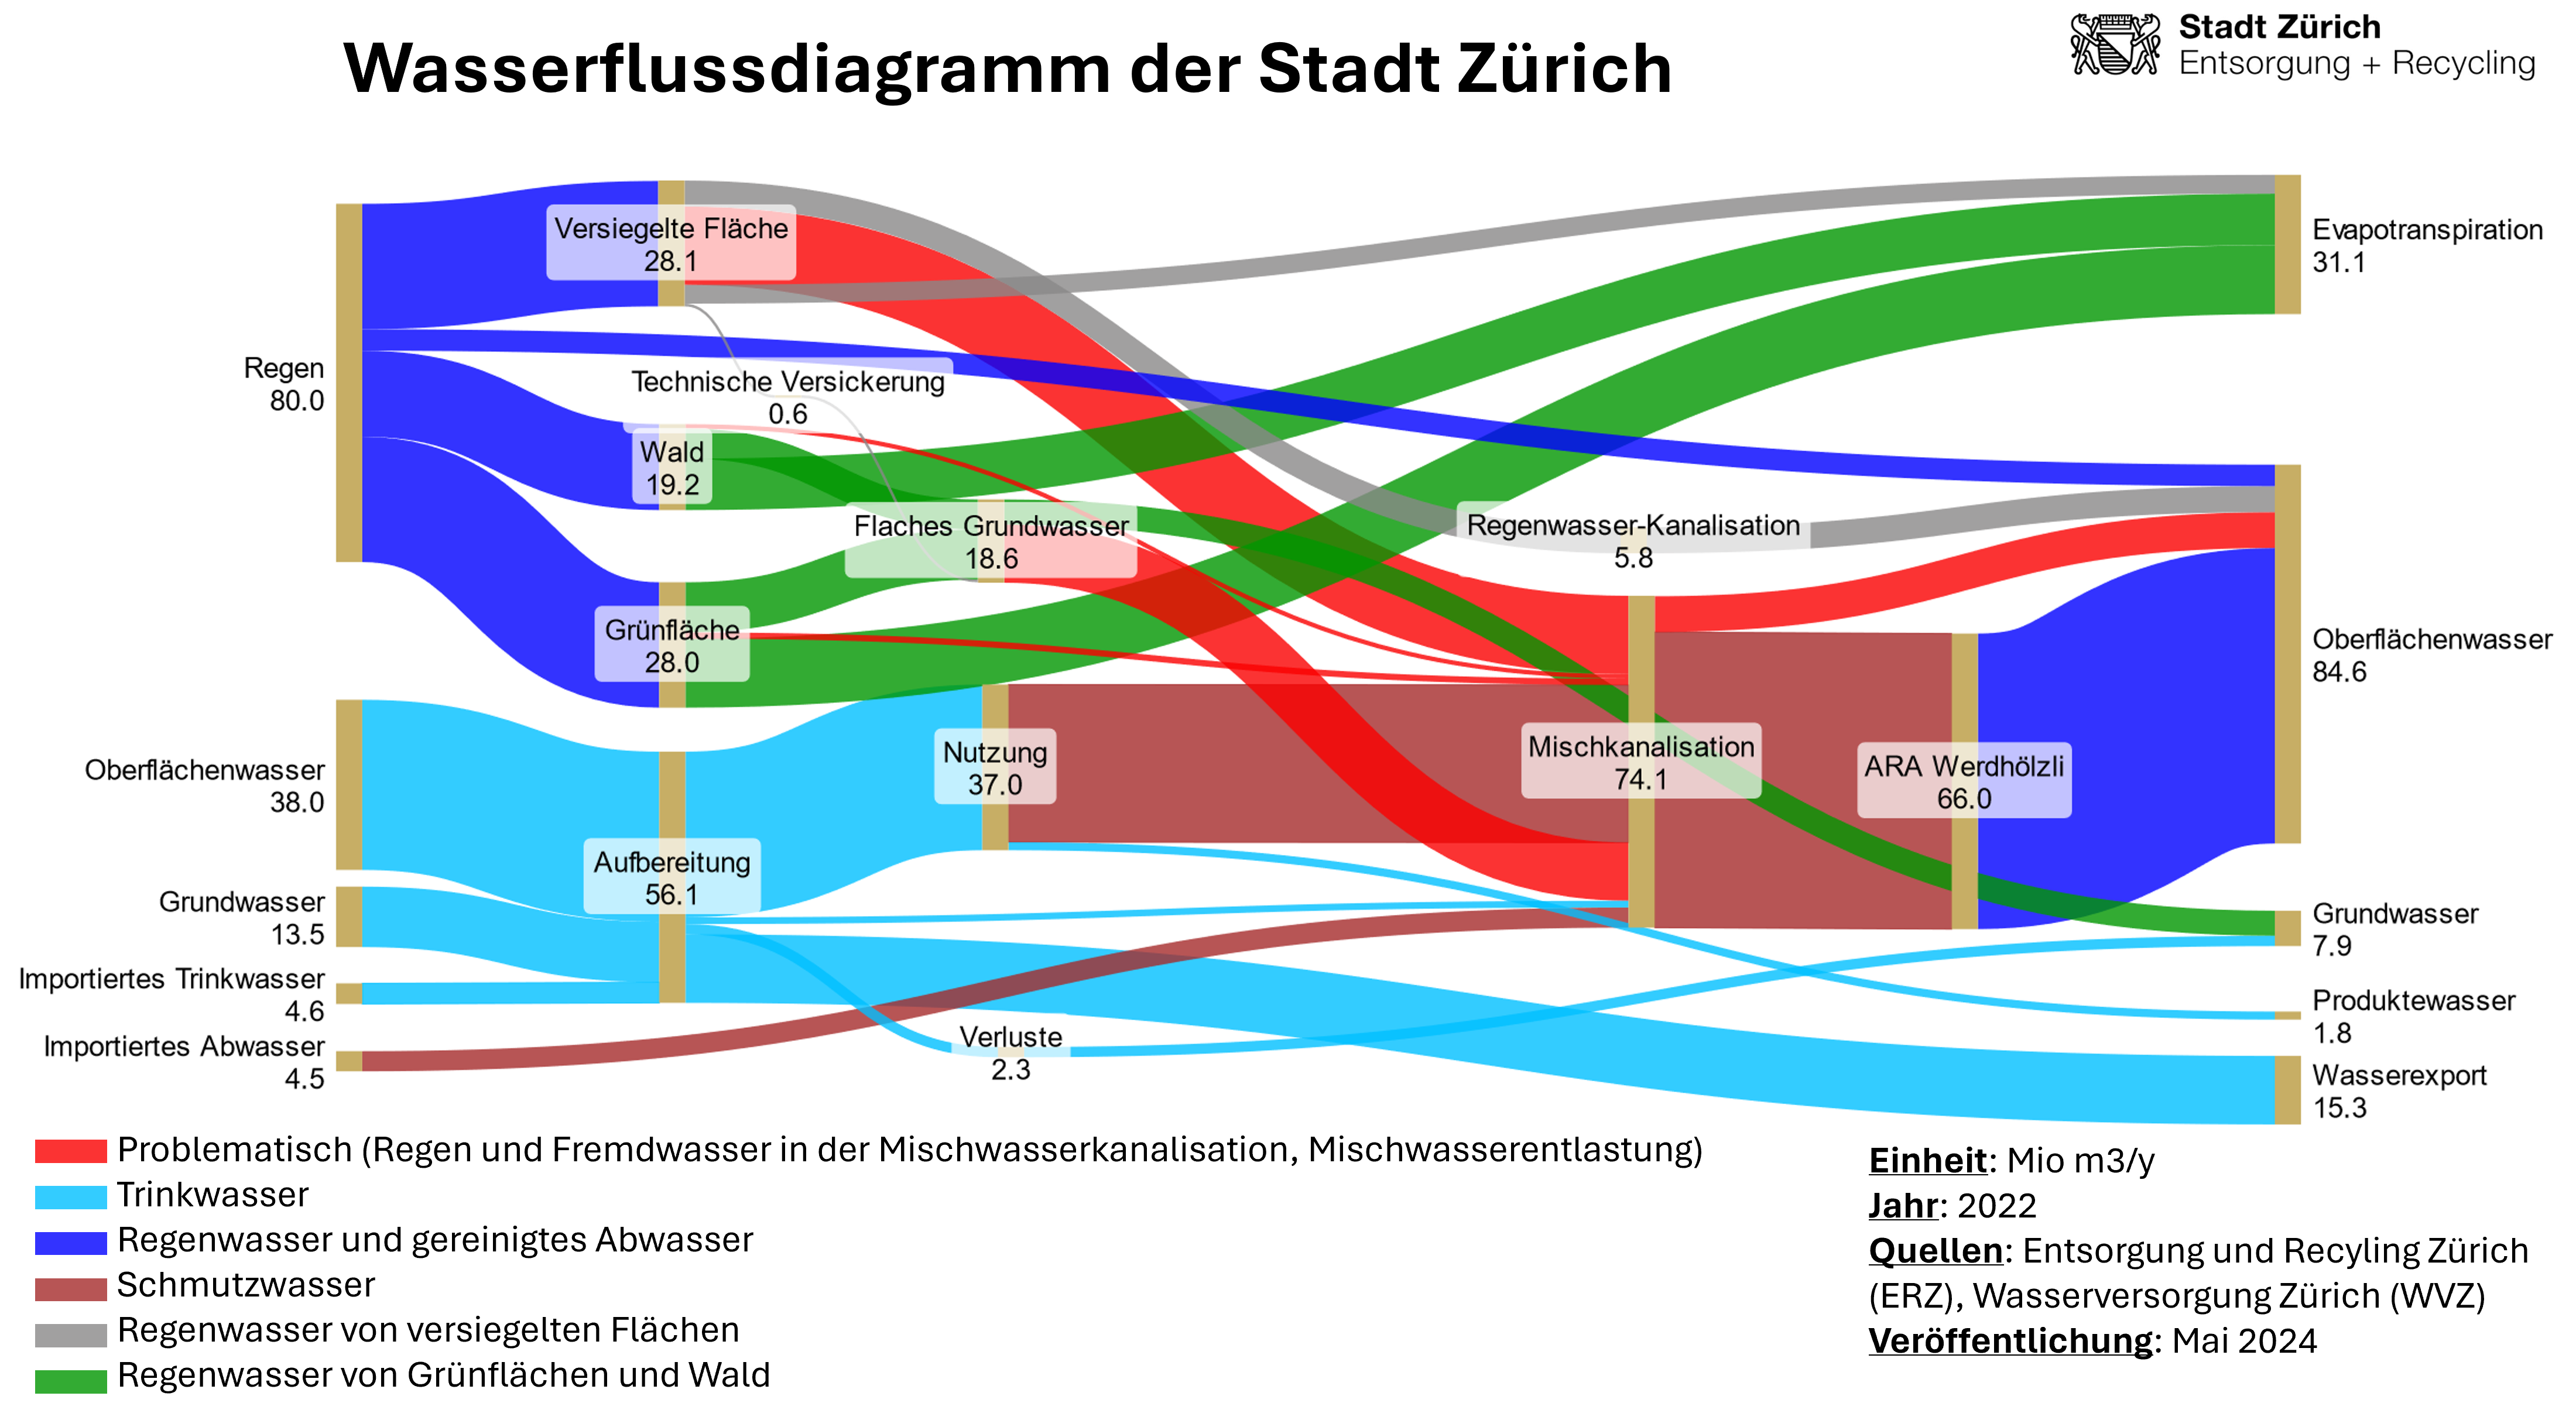
In Zurich, the basic WFD was extended with rainfall data. The extended version allows to track the rainfall along its path until it ends up in groundwater, surface water or back in the atmosphere after evapotranspiration. Particularly interesting for a city like Zurich was to visualise what proportion of rainfall flows into the sewer system, since rainwater contributes substantially to infiltration/inflow in sewer systems. In most cases it does not need to be treated and could be discharged directly into the environment, reducing the burden on wastewater treatment plants.
Above you can find the extended WFD of the city of Zurich (in german).
Problematic water flows, such as infiltration/inflow into the sewer system and combined sewer overflow are coloured in red.
The diagram combined in a unique way the data from both the water and the wastewater utility. It provides an overview of the water household of the city of Zurich in one diagram that is easy to understand for different stakeholders: utilities, planners and engineers, policy makers, and interested water users. The diagram can also be used to illustrate different situations or scenarios. For example, a scenario with blue-green infrastructure measures or in dry areas, the critical months in the dry period.
Finally, the WFD is a communication tool with the main objective of stimulating discussion and action on sustainable urban water management. The diagram provides stakeholders with an intuitive diagram to start their dialogue and develop creative strategies.
Contact
| Project leader global cooperation |