Tools
Organisations around the globe are invited to use the methodology for creating a WFD and make water management practices visible in their city!
Basic Methodology
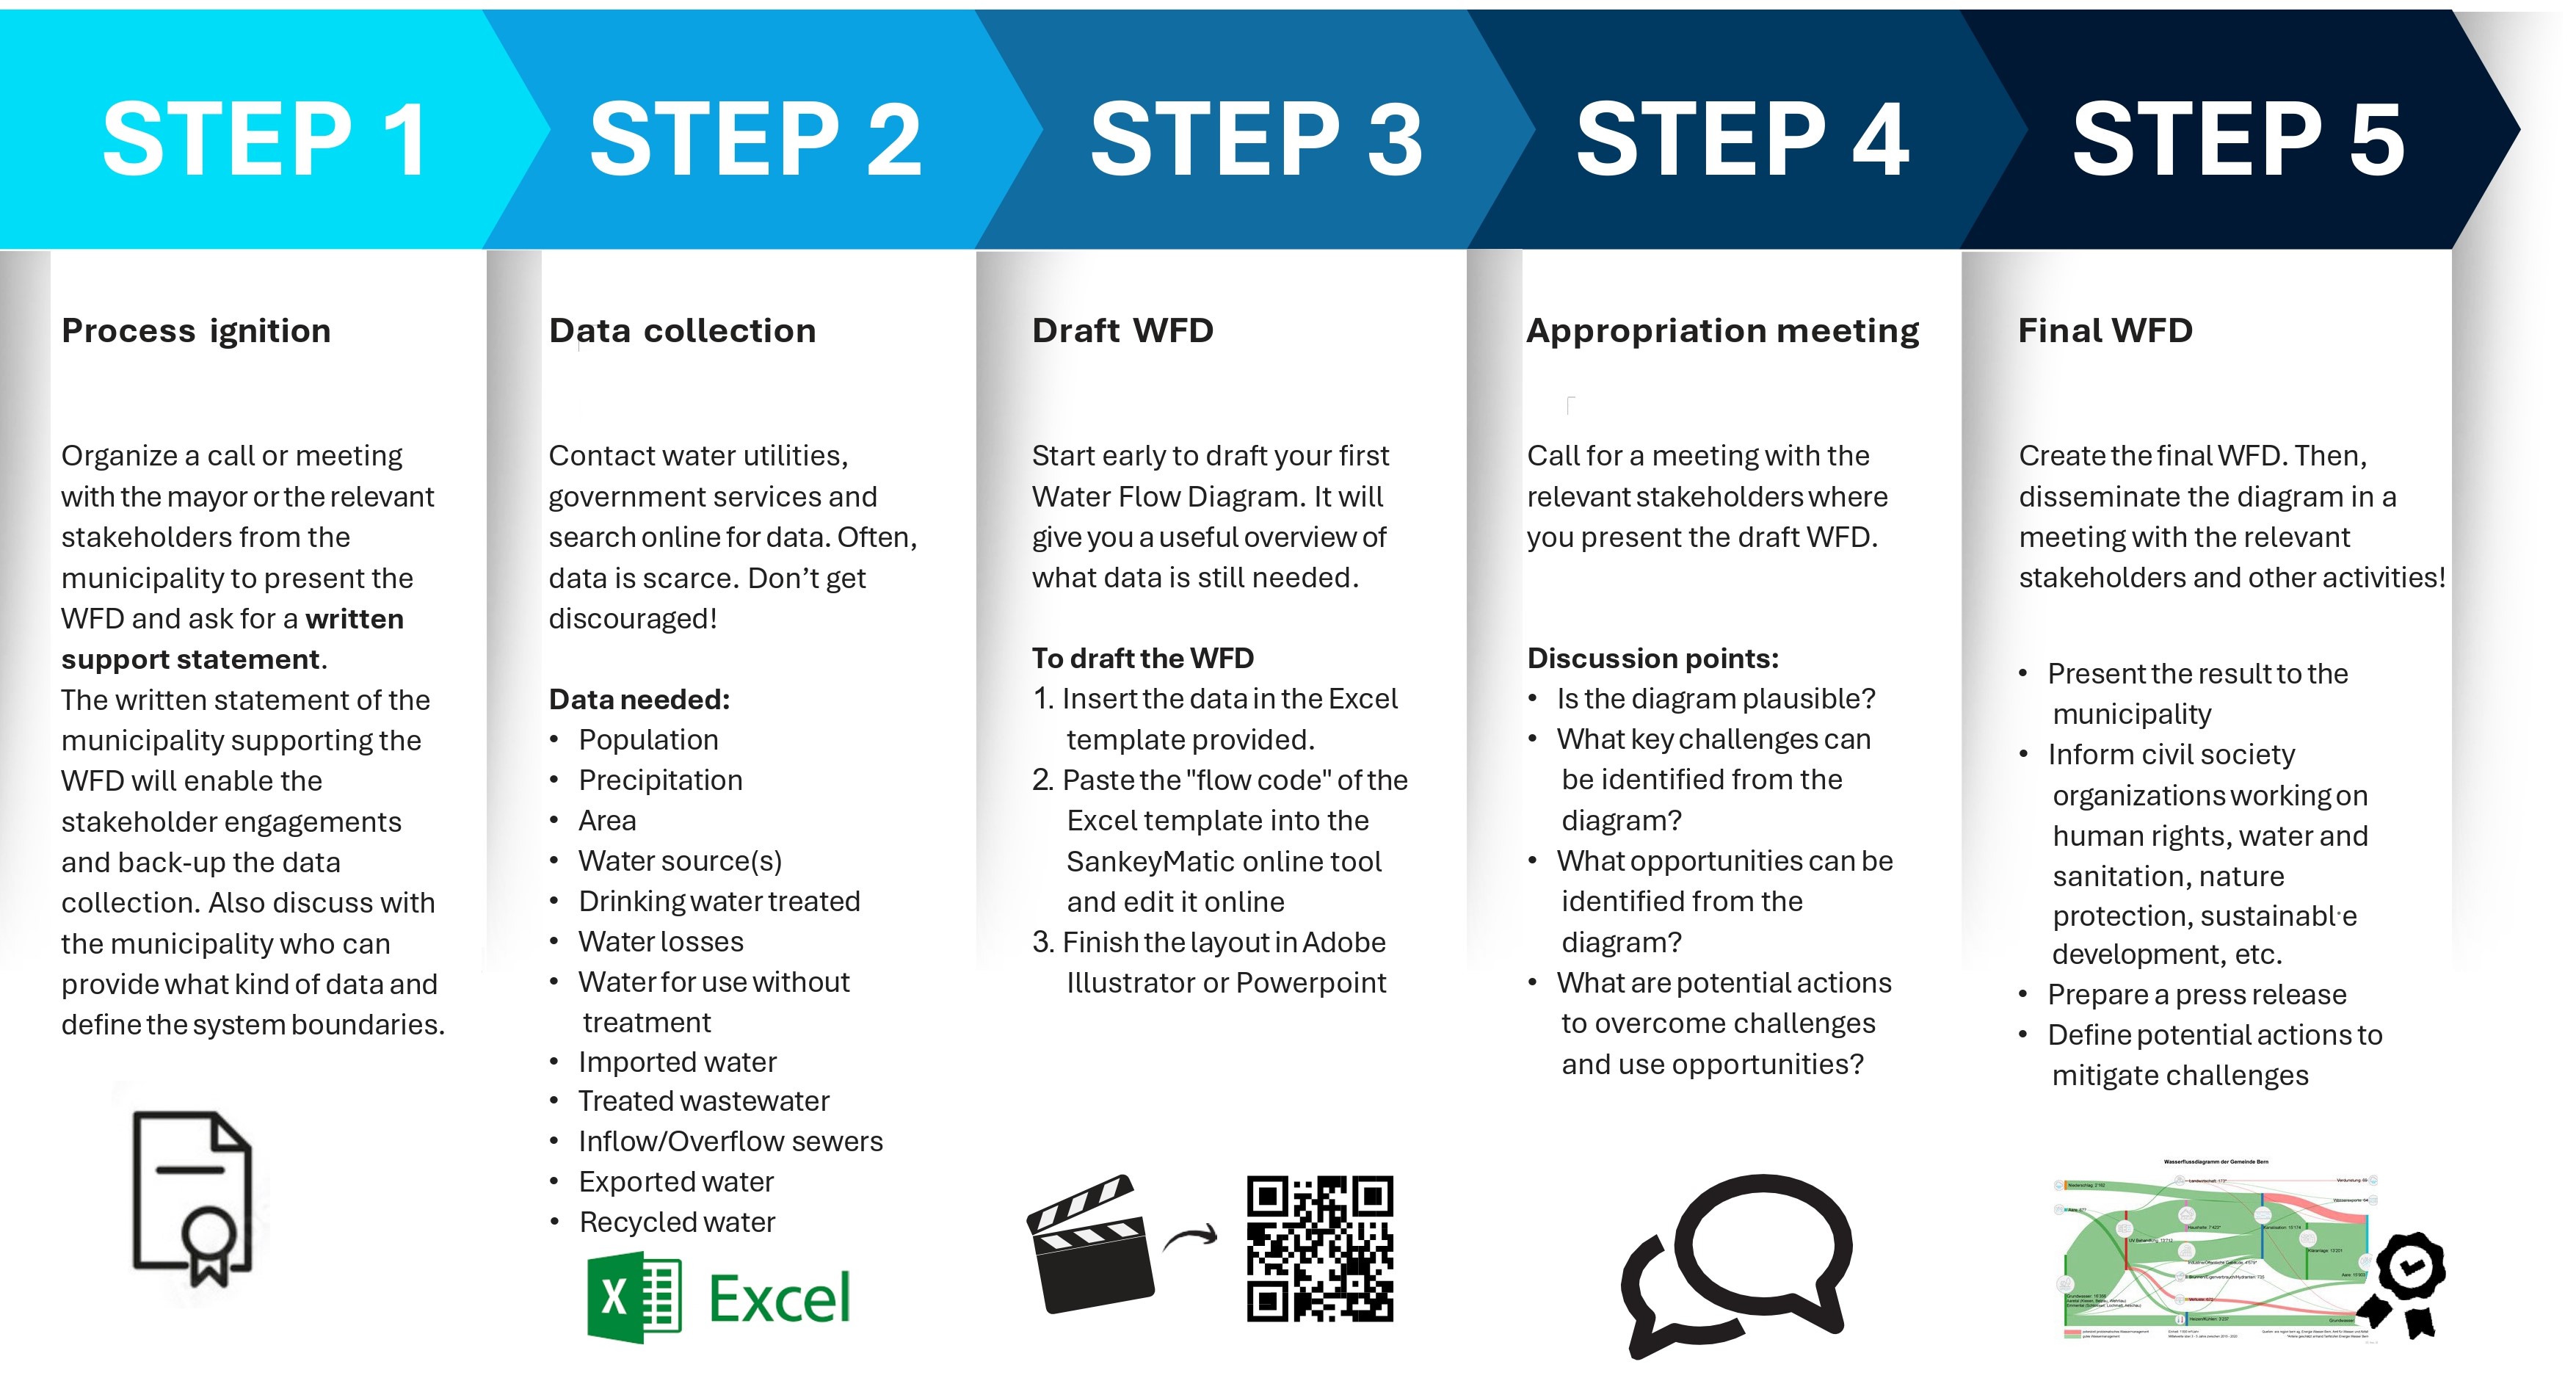
The basic method consists of five steps:
These five steps are described in more detail in a user guide that can be downloaded here: quick guide
To collect the data and bring it into the correct format, you can use the Excel template: data template
The actual making of the diagram is done using Sankeymatic.
After you computed the diagram in Sankeymatic, you can use the PowerPoint template to finalise the diagram: powerpoint template
The most complex step is the data collection. Depending on the data available, it can take several months to complete the data collection. However, there a draft version of the diagram with estimations instead of data can make data easier available or provoke a more detailed data collection. Once the data has been collected and is in the right format, making a diagram out of it is simple and only takes a couple of minutes.
Extended Method
In collaboration with the wastewater utility of Zurich (ERZ) an extended method was developed that also takes into consideration the total rainfall within the system boundaries. Currently, there is no user manual available for this method. The method is described in a final project report for the ERZ (in german).
If you wish to apply this method and need our support, please contact us. We are happy to assist you!